Signal Alarm List at run-time
Fully customizable and easy to use, the HTML Alarm Manager provides you with the possibility to view, acknowledge, filter, and export your alarms, while at run-time.
After preparing the Signal Alarm List extension as described in the Signal Alarm List at design-time chapter, the Signal Alarm List i4scada SmartEditor project is ready to be published.
The Signal Alarm List extension can show the alarm status which belongs to the signal, having the possibility to change the alarm processing and display mode.
The Signal Alarm List extension
After publishing the i4scada SmartEditor extension "wf-signal-alarm-list" the visual structure features the following sections:
The Signal Alarm List toolbar
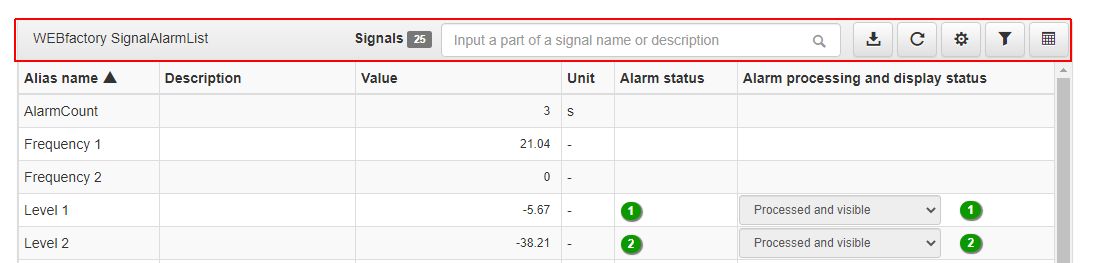
Signals - displays the list with the number of Signals counted.
Search - allows the user to search Signals, by typing a signal name or a description.

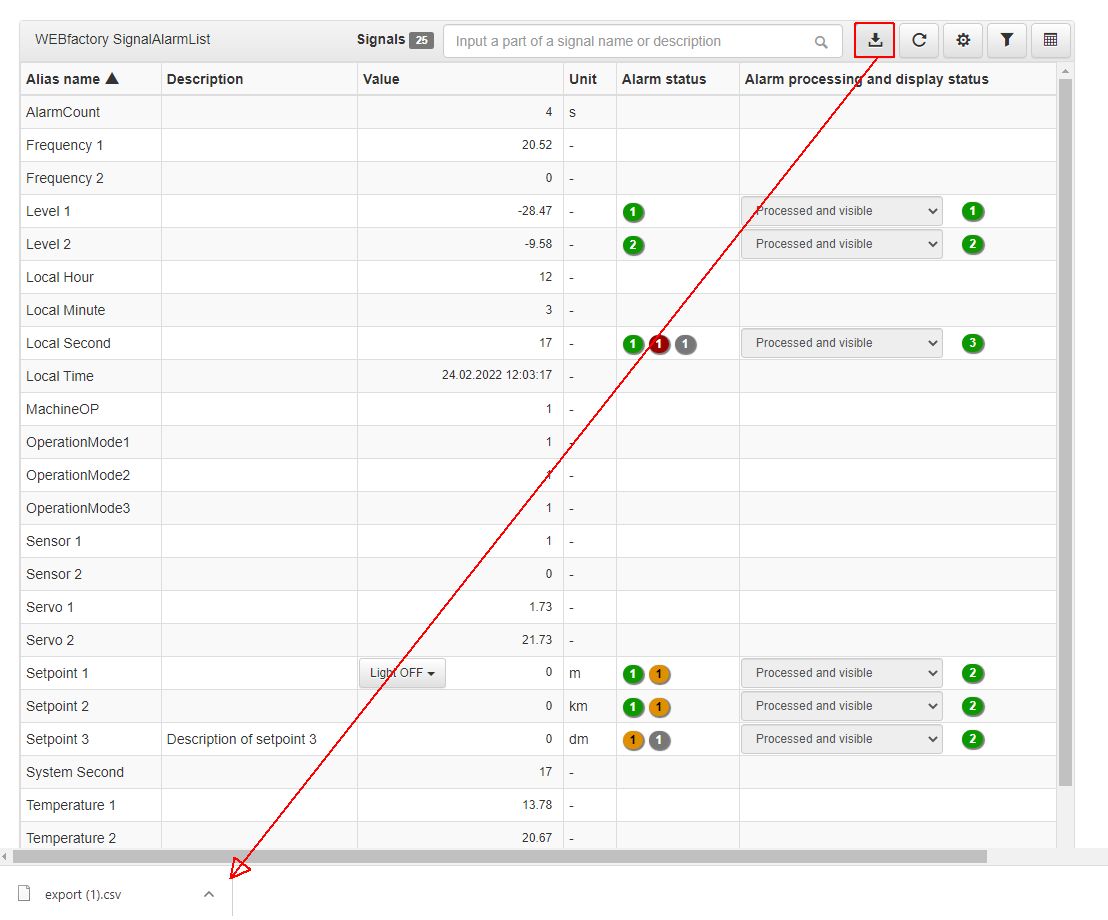
Export - triggers an export of the signal alarm list. As soon as the Export button is clicked, the CSV export will start directly in the browser.
Refresh - updates the Signal Alarm List, when the online mode is paused.
Configuration Manager - opens the dialog with the same name, where the user can save and reuse Filter and Time settings. The Configuration Manager dialog is split up into three tabs:
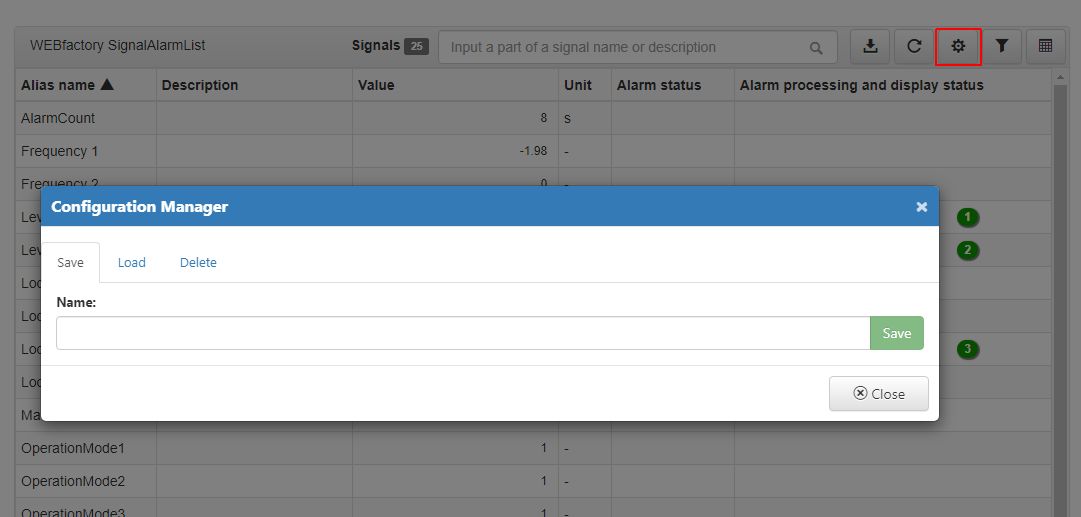
Save - after applying either a Filter or a Time interval, to the Logbook list, by visiting the Configurations manager under the tab Save, the user can preserve the previously applied filters.
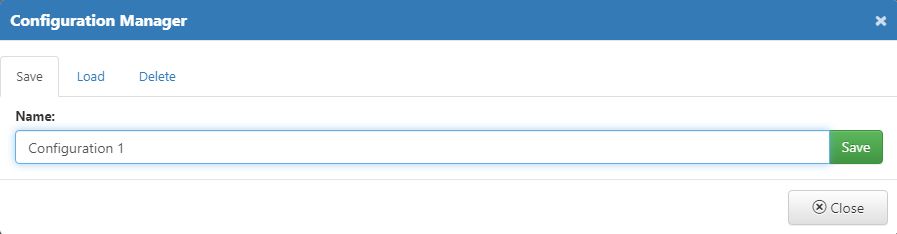
Inserting a new name for the saved configuration is required.
To preserve the configuration press the Save button and to discard the configuration and close the dialog, press the Cancel button.
Load - all previously saved configurations can be reused, in the Configurations Manager, under the Load tab.
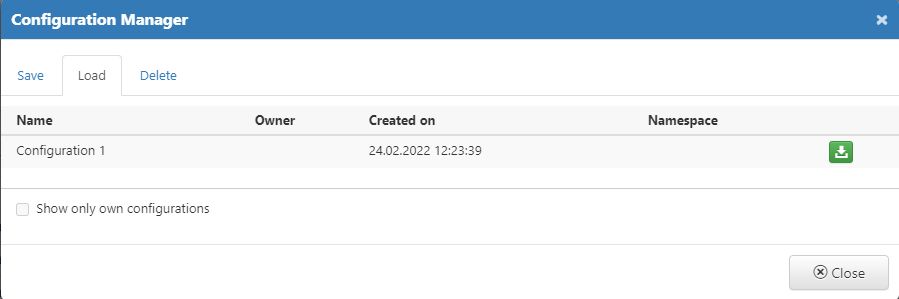
To load a saved configuration simply click the Load button. The filtering configuration is immediately applied to the list of Logs.
By enabling the option "Show only own configurations" the list is updated to display only those configurations defined by the currently logged-in user.
To close the Configuration Manager, without any further actions, click the Cancel button.
Delete - the Configurations Manager allows the user to remove the previously saved configurations, under the tab Delete.
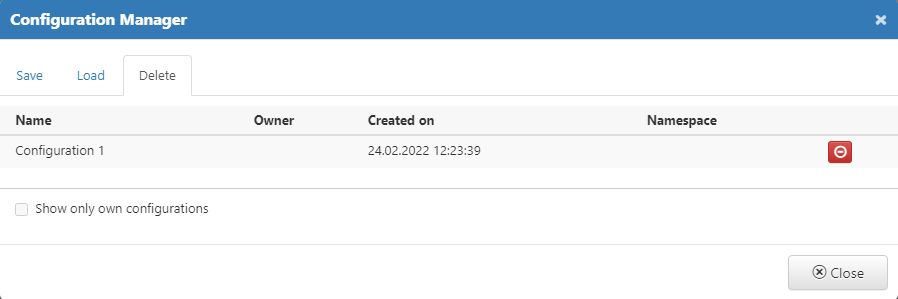
To remove a listed configuration press the Delete button.
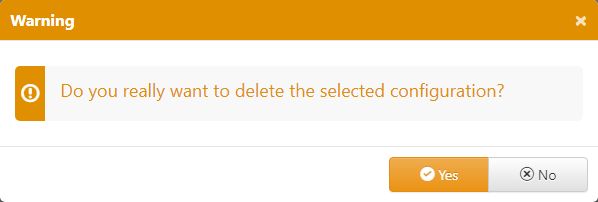
A confirmation dialog is opened where the available options are Yes (proceed with deletion) and No (do not delete).
Select Signal - allows the user to filter the list of Signals.
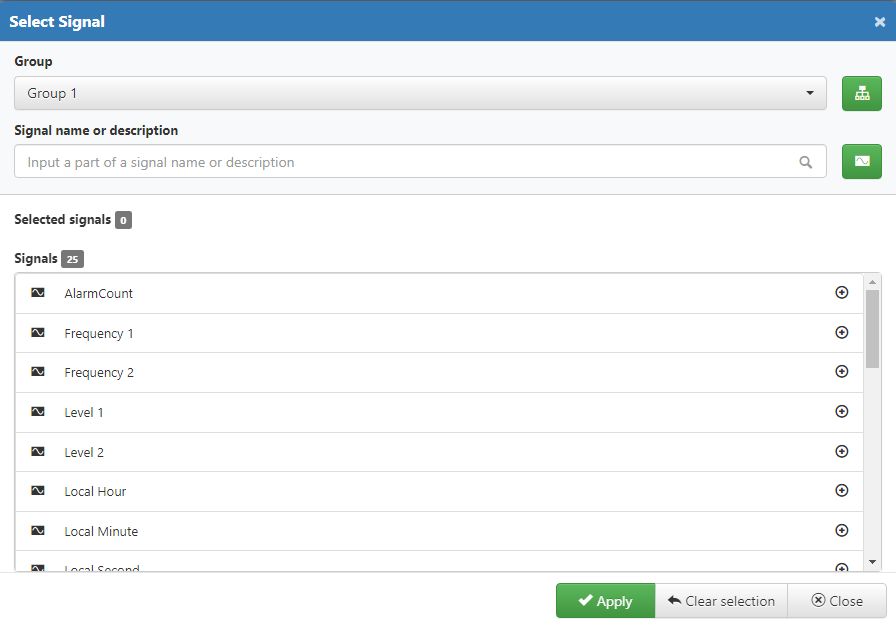
The Select Signal dialog provides the user with the following options:
Group - allows the user to filter the list by the signal group.
Search by signal name or description - allows the user to filter the Signals list by Signal name or part of a Signal name.
Selected signals - displays the number of selected signals.
Signals - allows the user to select the signal(s).
In the current dialog, the available options are Apply, Clear selection, or Close.
Settings - allows the user to manage the settings of the Signal Alarm List dialog.

The Settings dialog provides the user with the following options:
Maximum signal page count - sets the maximum number of signals.
Column view - allows the user to select/unselect columns.
Order of columns - allows the user to sort the order of columns.
In order to save the configuration, press Apply. If further actions are not required, click the Cancel button.
The list of Signal Alarm List items
Note
The Signal Alarm List columns can be sorted ascending/descending. The sorted columns are highlighted by the pointing up or down arrows visible in the column header.
Note
Signal updates will be shown (visible) in the signal alarm list after the browser is refreshed.
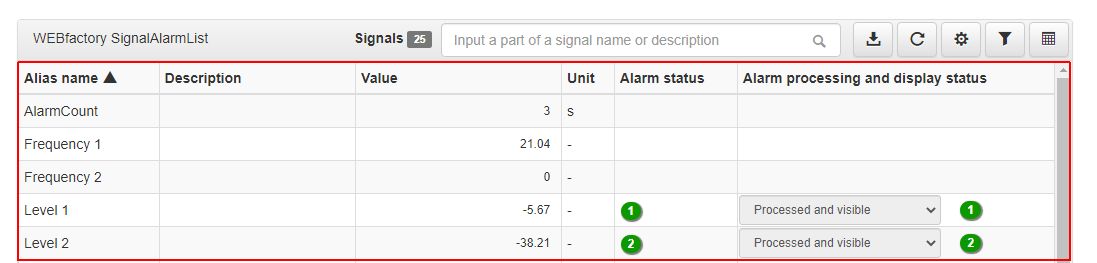
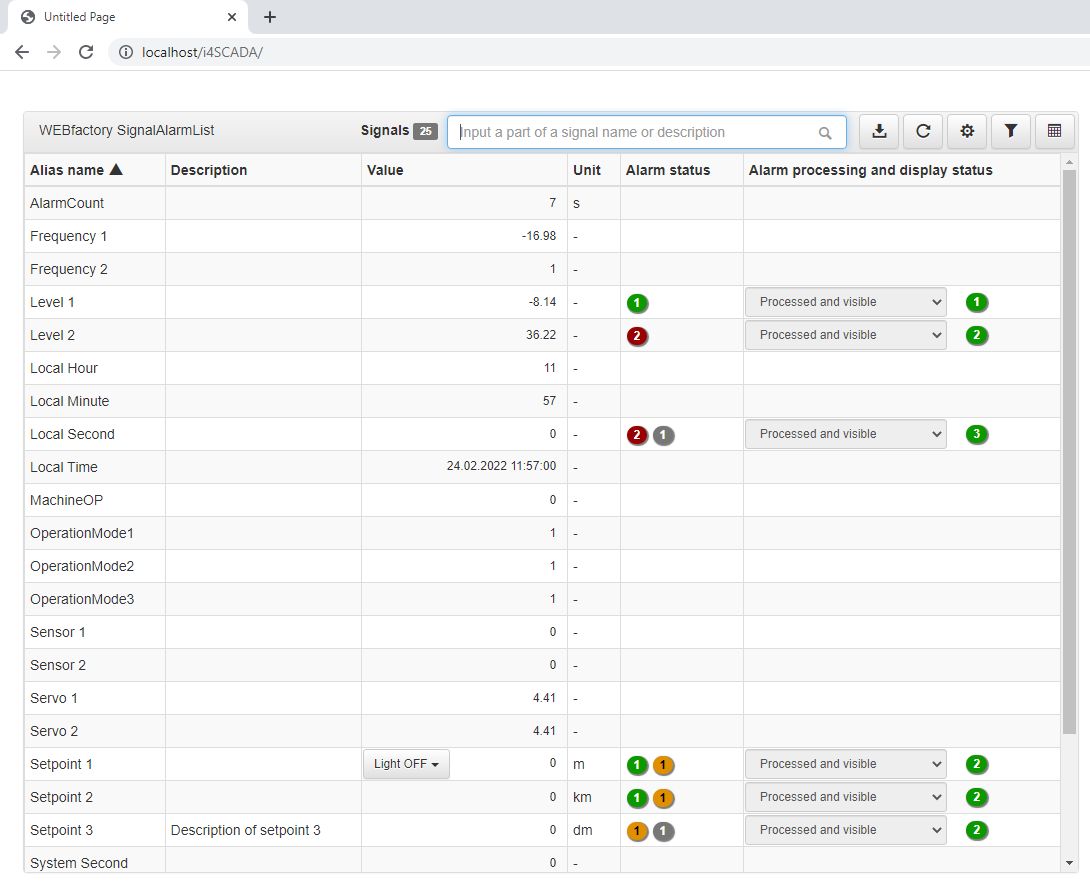
The Signal Alarm List items
Alias name - shows the name of the Signal.

Description - shows the description of the Signal.
Value - shows the signal value and allows the user to change signal values and discrete value types.
Unit - shows the unit of the signal.
Alarm status - the listed signals will display all the existing alarms using colored labels. The colors and number of the labels are updated on the fly as follows:
Green - Active alarms in status Off.
Red - Active alarms in status On.
Orange - Active alarms in status Acknowledge.
Grey - Inactive alarms.
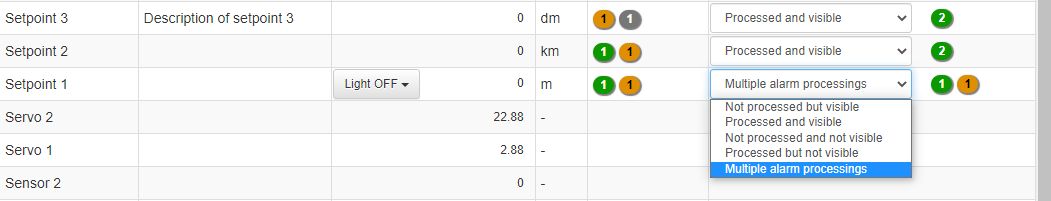
Alarm processing and display status - the listed signals will display all the existing alarms and their states. Besides the colored labels, this column also shows the current alarm state. Logged-in users can also manage alarm states using the drop-down list options. For more details about alarm management, please visit the dedicated article, here.
Tip
Signals having multiple ongoing alarm states will display a fifth category in the drop-down list named "Multiple alarm processings"